


Data has become increasingly valuable in our world. With around 182 zettabytes of data created and collected in 2025 (which is expected to grow exponentially in the upcoming years), many businesses want to exploit this data to understand their customers better and make more informed decisions. However, analyzing the raw data to derive insights is not that easy.
Recognizing this problem, Jean-Paul Isson and Jesse Harriott mentioned the IMPACT cycle of data analytics in their book “Win with Advanced Business Analytics: Creating Business Value from Your Data.” This cycle doesn’t guide data analysts to stay focused on the technical aspects of data analytics. But it helps derive actionable business insights effectively.
Until now, many companies have adopted the IMPACT cycle to answer specific questions based on data analytics and bring real-impact outcomes. If you want to know how, keep reading and discovering this cycle with us!
6 Key Steps of the IMPACT Cycle in Data Analytics
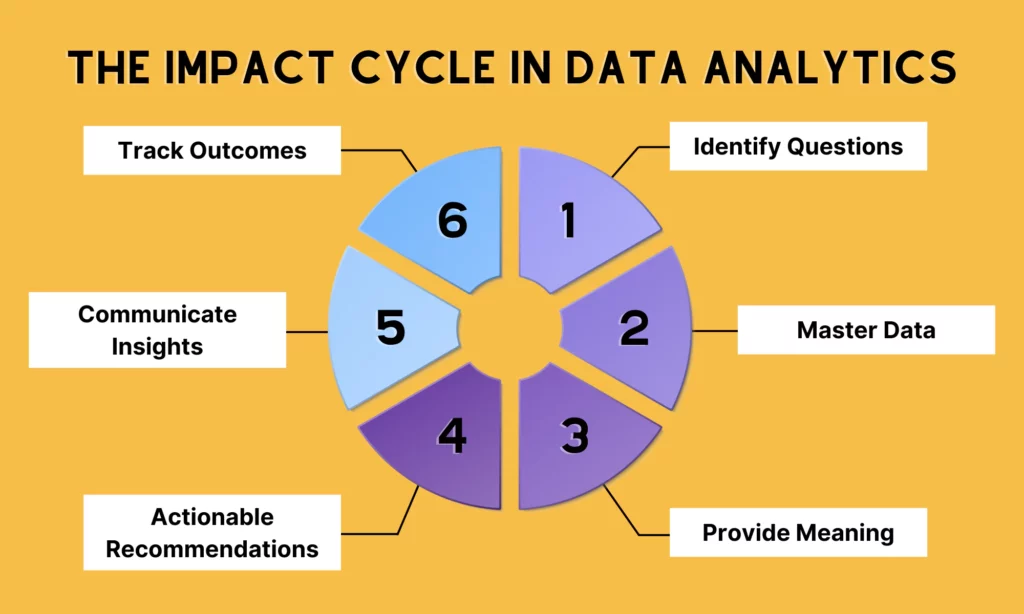
The IMPACT cycle is a practical framework that guides data users to turn raw data into something useful. It includes the following six steps:
Step 1: Identify the Question
The first step Jean Paul Isson suggested for the IMPACT cycle is identifying questions you need to answer to address certain problems. This step is crucial as it lays the foundation for a whole data analysis workflow. If you don’t know which business questions to answer, you may end up wandering aimlessly through your data. Further, you can waste time and effort in analyzing data without reaching any useful conclusion.
Asking clear, specific questions is crucial as well. If your question is too general and vague, you hardly narrow your scope of data analytics and easily get lost in vast datasets. Besides, a poorly defined question makes it challenging to identify the right data points and analytical techniques. This makes it hard for you to interpret your findings and derive actionable insights.
So, what is called a “well-defined, specific question”? Here are some examples:
Don’t ask:
- What’s wrong with our website? (Too general and vague, giving no specific direction for analytics)
Should ask:
- Why has conversion decreased in the last quarter? (Measurable and focuses on a certain problem)
Don’t ask:
- What do customers think about our updated app? (Too broad and doesn’t clarify which aspect of the service to focus on)
Should ask:
- How satisfied are customers with our new AI-powered chatbot on our app? (Specific and focuses on a certain feature)
How to Ask Effective Questions with SMART
To formulate critical business questions, you can adopt a SMART framework:
- Specific: The question should be clearly defined and not too general.
- Measurable: The answer to the question should be measured.
- Achievable: The question should be answered with available data.
- Relevant: The question should directly relate to the result you want to achieve.
- Time-bound: The question should have a specific timeframe for investigation.
For instance, if your goal is to improve engagement on your new app, ask a relevant question like, “How can we enhance user engagement in our mobile app?” You can add some SMART elements to make the question clearer, like “How can we increase daily active users by 20% in the next quarter?” The question offers a more specific target for data analysis, giving meaningful insights to devise appropriate marketing strategies.
Step 2: Master the Data
Once you’ve formulated a great question, you’ll need essential information to answer it. According to Jean-Paul Isson, this step is a “sweet spot” for data analysts where they can gather, prepare, and analyze all available information to answer the business question.
Data Collection
To begin this phase, you need to collect data from different sources. These sources can be databases, APIs (Application Programming Interfaces), CRM (Customer Relationship Management) systems, surveys, social media platforms (e.g., Facebook or Twitter), internal documents, and web analytics.

Remember, choose all data sources that can offer the right information to answer your question. For example, you want to find out why users abandon your website. You may collect data from:
- surveys to receive direct feedback about user experience with the site;
- web analytics to understand how users are interacting with the site, where they abandon the site, and which features they use most;
- CRM systems to collect demographic information about users and their previous interactions with your business.
To accelerate the data collection and preparation process, you can use data integration platforms like Qlik which allow you to collect data in a unified place within seconds. Additionally, for advanced use, you can use programming languages like Python or R to write scripts for automating data collection, accessing API data, and performing complex data transformations.
Data Cleaning, Transformation & Validation
Raw data is not perfect as it often has missing values, inconsistencies, and other errors. That’s why you need to clean, transform, and verify it right after collection.
Cleaning data refers to removing or fixing any error within the data. Then, you need to transform data into a usable format for analytics. For instance, grouping ages into ranges or converting dates into a consistent format. Finally, double-check the data to ensure it’s complete, accurate, consistent, and reliable for analytics. Otherwise, poor-quality data can render your analysis flawed, leading to meaningless insights.
Today, you can use spreadsheet software (e.g., Google Sheets or Microsoft Excel) for basic manipulation or tools (e.g., Trifacta Wrangler or OpenRefine) for advanced data cleaning and conversion.
Simple Data Visualization
In this step, Jean also suggested creating clear and simple visual presentations of the data. These data visualizations help even non-technical experts access complex data and understand the main points easily. Today, you can use available data analysis tools like Superset or Tableau to build graphs, charts, and interactive data dashboards for different stakeholders.
Step 3: Provide the Meaning
You’ve completed your analysis and presented your data in clear visualizations. So now, it’s time to provide the meaning behind this data. In other words, the third step of the IMPACT cycle helps you answer the question “What does the data actually tell me about the business issue I’m trying to resolve?” By analyzing and interpreting the data, you can derive actionable insights that drive the best decisions to handle your critical business problem.
In doing so, you need to dig into the data and discover relationships or patterns using analytical techniques. These techniques include quantitative and qualitative analyses. Accordingly, the former involves analyzing numerical data to quantify relationships between data variables. Meanwhile, the latter focuses on analyzing non-numerical data (e.g., text or audio) to understand sentiment and contexts. Further, you can use machine learning algorithms to explore relationships and patterns within large datasets.
Once you’ve discovered patterns, it’s time to interpret them with data visualizations. Remember, your interpretations should be clear and easy to follow. To do so, follow some tips:
- Avoid technical terms or jargon your audience may not understand. Instead, use plain language and interpret your findings clearly.
- Get to the point directly. Don’t mention unnecessary content that can distract your audience from the main points. Instead, focus on the most important details and present them concisely.
Step 4: Actionable Recommendations
You’ve interpreted the data and derived meaningful insights. Now what? It’s time to convert all these insights into concrete and quantifiable recommendations that your business can take to address specific problems. Accordingly, these recommendations should be specific and business-oriented. They should directly relate to the insights you extracted from the data and solve certain business questions (e.g., increasing customer satisfaction on the app).

Here are some things to consider when you make certain recommendations based on data interpretation:
- Avoid too general and vague suggestions like “redesign the checkout process.” Instead, suggest something more specific and measurable. For example, “decrease the number of steps in the checkout process from the current 5 steps to a maximum of 3 to reduce cart abandonment rate by focusing on key fields (e.g., payment details and address) and allowing for autofill.”
- Evaluate and prioritize suggestions based on their feasibility and potential impact. You can leverage a combination of techniques to assess which one has a bigger impact on business outcomes. These techniques include A/B testing, impact/effort matrix, cost-benefit analysis, and more. Plus, you can talk to experts in your company who have relevant experience (e.g., product developers or sales executives). They may give you valuable opinions about the potential impact of your suggestions.
Step 5: Communicate Insights
Next, you’ll communicate meaningful insights to your audience who can actually use them to make informed decisions. In this phase, Jean advised data analysts to adopt a multi-pronged communication strategy. This refers to using many communication channels and methods to reach different segments of a target audience in your company. As not everyone can understand your insights in the same way, using this strategy helps you customize your communication to the specific needs of your audience.
Below are some communication methods you may consider:
- Interactive Dashboards: Creating an interactive dashboard helps your audience discover insights on their own.
- Recorded WebEx/Presentation: Recorded presentations enable people, especially those who were absent from a live meeting, to watch and learn your insights.
- Executive Memo: Well-written, concise memos communicate key findings and suggestions to senior management.
Besides, you can consider other communication methods like formal reports, infographics, email, and intranet posts. According to Jean-Paul Isson, a more informal setting like a lunch and learn can be an effective way to engage with coworkers and encourage discussions about your insights.
Regardless of your communication methods, remember to choose the style that fits your audience. Also, keep your communication simple by using plain language and avoiding technical terms. Leverage visuals and structure your communication in a way that tells an engaging story. Further, you should predict questions your audience can ask and be prepared to answer them confidently.
Step 6: Track Outcomes
The final step of the IMPACT cycle in data analytics is tracking outcomes. This phase is very crucial as you can identify whether your analysis was precise and your recommendations were effective. Further, you can determine areas for improvement if you find your recommendations as ineffective as expected.
According to Jean-Paul Isson, you need to establish tracking mechanisms to measure key metrics that are relevant to recommendations. These mechanisms can be dashboards, reports, or something. Further, you should determine which specific metrics to track, depending on the goals of your recommendations.
For instance, if you recommend simplifying the checkout process (as mentioned in the example above), you can use eCommerce analytics platforms, usability testing, and online surveys to track key metrics like cart abandonment rate and checkout completion rate. Plus, consider other indicators (e.g., time to checkout completion, user satisfaction, and error rate on checkout pages) to get contextual insights into this recommendation.
Remember, only tracking the metrics is not enough. You should communicate and share the outcomes with those who are directly in charge of implementing the recommendations. This helps them understand what was done, whether the changes brought the desired outcomes, and where to improve. Then, you can use the findings to determine new questions that need to be answered and encourage further analytics.
FURTHER READING: |
1. 10 Leading Data Analytics Companies in 2025 |
2. No-Code Data Analytics: A Comprehensive Guide |
3. 10 AI Data Analytics Tools Transforming the Industry in 2025 |
Why Should You Learn About the IMPACT Cycle?

The IMPACT cycle is crucial for any business that wants to conduct data analytics effectively. No matter who you are (e.g., a project manager or data analyst), you can use this structured approach to stay focused and organized by asking the right questions, using the right data, and gaining the right conclusions. This cycle acts as a blueprint for building a house. Without it, you can easily get lost in vast amounts of data, and worse, generate wrong insights that may cause misleading decisions.
Particularly, here’s what you may get if you adopt the IMPACT cycle in your data analytics workflows:
- Understand your data better. The IMPACT cycle helps you identify what data is available, how they relate to your current problems, and how to manipulate data to address these issues.
- Communicate better. It offers a structured framework to communicate your results clearly to stakeholders (normally through data visualization).
- Measure outcomes. The cycle allows you to track analytics results frequently. So you can see how data analytics makes a real-life impact on your business.
- Enhance decision-making. Using the cycle helps you make better decisions based on the right data and appropriate analytics techniques. It gets rid of the guesswork and unorganized analysis approaches.
- Minimize risks. Following a structured framework enables you to analyze data more effectively and reduce the risk of reaching inaccurate conclusions from your data.
Are There Any Challenges When Adopting the IMPACT Cycle?
Although the IMPACT cycle provides us with a structured approach for effective data analytics, conducting it successfully is not as easy as pie. Below are some challenges you may encounter when adopting the cycle:
- Time Investment: Each step of the IMPACT cycle needs time and effort investment. Rushing through these steps can make your analysis and recommendations ineffective.
- Difficulty Identifying Questions: The first step of the cycle – defining crucial business questions – is often the hardest. If a question is poorly defined or too broad, a whole analysis workflow will go astray.
- Data Quality Issues: If your data sources are of poor quality, you may conduct flawed analyses and draw unreliable conclusions.
- Need for Skilled Personnel: To implement the IMPACT cycle effectively, any individual involved needs to possess strong data skills, from data collection and cleaning to analysis and visualization. Further, they need to know how to communicate findings to stakeholders.
- Challenges in Measuring Long-Term Impacts: It’s quite challenging to measure the long-term influence of your insights and suggestions.
Strategies for Handling These Challenges
There are various strategies you may implement to overcome these challenges:
- Focus and Prioritization: Don’t try to resolve all your existing business questions at once. Instead, focus on the most important and prioritize the analyses that may have the biggest impact on your business. This allows you to manage your time and resources for analytics effectively.
- Clearly Identify Initial Questions: Use adequate time and effort to determine the initial question you need to answer. Leverage SMART criteria to keep your question clear and answerable, as well as don’t forget to involve key stakeholders in the analysis process.
- Manage Data Quality: Create clear processes for data collection and manipulation. Also, frequently audit and check your data to ensure data quality and reduce the risk of errors in analytics.
- Invest in Training & Upskilling: Offer training to upskill and reskill employees on data analysis techniques, tools, and the IMPACT cycle. This helps you build the skilled personnel to implement the analysis process effectively.
- Develop Long-Term Tracking Plans: Devise a plan to track the long-term impact of recommendations. Also, determine key metrics to measure success and identify a specific timeline for follow-up.
- Leverage Project Management Tools: Use these tools to track progress on every step of the IMPACT cycle. This ensures that all tasks are completed timely and enhances transparency.
Conclusion: Enhancing Your Software Performance with Designveloper
This article has given you an overview of the importance, challenges, and 6 key steps of the IMPACT cycle in data analytics. Mastering and implementing these steps helps you analyze available data in a structured and effective way to resolve your company’s existing problems.
But in case you’re looking for a reliable, experienced partner to improve your website or app’s performance, consider Designveloper!
With our deep expertise in both software development and data analytics, we’ve supported clients across industries to increase customer retention and boost sales. One of our successful projects is an eCommerce website for household appliances.
By analyzing key metrics from web analytics (e.g., page visits and click rates on features) and using analytical techniques to identify patterns in customer behaviors, we suggested our client make appropriate improvements in key features such as the search bar and filtering options. This change brought excellent results, typically higher page visits (from 100 to 20,000 visits/month), longer stay on the site (from 1.2 to 9.3 minutes/visitor), and higher checkout rates (from 12% to 33%). As a result, the total sales of the site increased afterward.
So, if you want to change your software performance from now on, don’t hesitate to contact us and discuss your problem further! We’re committed to delivering the best results that drive your business growth and sales.
Also published on

Share post on


Read more topics